Q: How is multiple sclerosis diagnosed?
Multiple sclerosis (MS), an autoimmune, demyelinating, and neurodegenerative condition of the central nervous system, is diagnosed based on clinical features (history and neurological examination) supported by paraclinical evidence including imaging (magnetic resonance imaging, optical coherence tomography), laboratory (cerebrospinal fluid testing), and neurophysiological testing (visual evoked potentials). Guidance for the diagnosis of MS is codified in the McDonald Criteria, which were last updated in 2024.1 The diagnosis of MS has historically been based on demonstration of lesions disseminated in space (DIS) and in time (DIT). While DIS and DIT were initially based on clinical history and exam findings, increasingly the criteria allow for DIS and DIT based on paraclinical features, and most recently, the requirement of both DIS and DIT is being relaxed. The first step, before the diagnostic criteria are applied, is to ensure there are no better explanations for the clinical and radiological features at presentation. Ultimately, MS remains a diagnosis of exclusion. This document will provide an overview of the diagnostic process with some key features to keep in mind when making a diagnosis of MS. It is important to note that the McDonald Criteria and this document are intended as a guide to MS diagnosis, not treatment criteria. The latter is an important but separate question and is answered in other Mellen Center Approach documents available at the following link: Mellen Center Multiple Sclerosis Approaches.
Q: Who is affected by MS?
MS affects all populations and regions in the world and can affect patients of any age. MS is more common in young females with an average age of onset between 20 and 30 years and a 3:1 female to male ratio.2 MS affects nearly 1 million people in the United States and globally affects 2.8 million individuals as of 2020. Higher prevalence is seen in North America and Europe, but prevalence data are limited in some countries.3 Although MS was historically thought to affect mainly non-Hispanic White populations, recent data has shown that MS prevalence in Black populations is similar to non-Hispanic White populations and is increasing in Hispanic populations.4,5 Given the growing data describing the diverse populations affected by MS, the diagnosis of MS should be considered in all individuals with concerning symptoms or MRI features regardless of race, ethnicity, or geography.
Q: How do patients with MS present?
The most common presentation of MS is with clinical attacks (90% of typical clinical presentations).2 Demyelinating attacks are characterized by neurological symptoms developing acutely or subacutely lasting at least 24 hours in the absence of fever, infection, or other provoking factors. Common examples of typical attack syndromes include unilateral optic neuritis, brainstem or cerebellar syndromes, and partial myelitis.6 Alternatively, presentations with insidious progressive neurological disability are less frequent (10% of typical clinical presentations).2 Progression in MS is considered in presentations with objective clinical neurological progression of disability without relapses over the course of at least 12 months.1
In earlier iterations of the McDonald criteria, a typical demyelinating attack or disease progression were required to make a diagnosis of MS.6-9 However, over recent years, the field has shifted to focus on biologic mechanisms of MS and considers the disease presentation and course on a continuum rather than as distinct categories.10 Asymptomatic patients or patients with symptoms not specific for MS can also have MRI and CSF evidence of demyelinating disease and are at a similar risk of subsequent disease activity.11,12 Although a typical demyelinating attack or progression strongly suggests MS, the diagnosis can be considered in asymptomatic individuals and those with symptoms not specific for MS found to have imaging features suggestive of MS.
Q: Which mimickers should be excluded when evaluating a patient for possible MS?
Numerous vascular, genetic, metabolic, structural, infectious, neoplastic, and other systemic and neurologic inflammatory disorders can mimic MS.13 Evaluation of alternative disorders should be tailored to the patient based on the clinical syndrome, paraclinical test results, and individual risk factors. When clinical presentations overlap with other demyelinating diseases (presentations with optic neuritis and myelitis or specific imaging features), we assess aquaporin-4 (AQP4)-IgG and myelin oligodendrocyte glycoprotein (MOG)-IgG using cell-based assays, but we interpret results, particularly low titer results, cautiously.14,15 During the disease course, the differential diagnosis should be revisited if features atypical of MS arise.
Q: How did the 2024 McDonald Criteria change the approach to the diagnosis of MS?
Historically, the diagnosis of MS was based purely on clinical symptoms and exam findings.6-9 With advancements in paraclinical testing, the diagnosis of MS has moved to a greater reliance on biological markers, which has enabled earlier and more accurate diagnosis. The overall goal of the 2024 McDonald criteria was to provide a globally applicable framework for the diagnosis of MS regardless of age or presentation, reflecting the current understanding of MS as a disease spectrum.16 Although the traditional concepts of DIS and DIT remain in the current criteria and can be used to make a diagnosis, the new criteria have evolved away from strict requirements for DIS and DIT to make a diagnosis of MS. A summary of key updates is provided below and elaborated on later in the text.
2024 McDonald Criteria updates:
- The optic nerve serves as a fifth anatomical location to demonstrate DIS.
- DIS is fulfilled when there are lesions in 2 of 5 anatomical locations.
- DIT is not required to diagnose MS in some circumstances.
- The diagnosis of MS can be made in those with symptoms not specific for MS and in those with incidental findings of demyelination.
- The central vein sign (CVS) and paramagnetic rim lesions (PRLs) are imaging biomarkers that can be used to aid in the diagnosis of MS.
- Kappa free-light chain (kFLC) index can be substituted for oligoclonal bands (OCBs) when evaluating cerebrospinal fluid (CSF).
- A unified diagnostic framework is applied to pediatric and progressive MS.
- Additional features are recommended when evaluating patients older than 50 years of age or with vascular risk factors.
Q: How is DIS determined using the 2024 McDonald criteria?
DIS is met when at least 1 lesion is present in 2 or more typical anatomic locations. Typical anatomical locations historically included periventricular lesions (white matter lesions which touch the ventricle surface), juxtacortical lesions (lesions that abut the cortex with no intervening white matter) or intracortical lesions, infratentorial lesions, and spinal cord lesions. On brain MRIs, MS lesions are required to be at least 3 mm in diameter but vary in size based on location.17 In the 2024 McDonald criteria, the optic nerve was added as a fifth anatomical location based on multiple studies showing it increases diagnostic sensitivity without sacrificing specificity.1,18,19 With this addition, DIS is now met when 2 of 5 anatomical locations have characteristic lesions. In those with progression onset, the presence of two spinal cord lesions also meets DIS. Additionally, patients presenting with a typical attack or progression can be diagnosed with MS when lesions are present in ≥ 4 of 5 anatomical locations without any further requirements.1
Q: How is optic nerve involvement established in MS?
Optic nerve MRI, optical coherence tomography (OCT), and visual evoked potentials (VEPs) can all be used to evaluate optic nerve involvement in MS and can contribute to DIS in the 2024 criteria. In acute optic neuritis, optic nerve MRI is the most helpful modality to evaluate optic nerve damage as it can confirm the diagnosis and suggest alternative diagnoses such as neuromyelitis optica spectrum disorder (NMOSD), MOG antibody-associated disease (MOGAD), and non-inflammatory conditions. Although MRI of the brain can detect optic nerve lesions, dedicated orbital MRI with fat saturation can better highlight symptomatic and asymptomatic optic nerve involvement.20 When obtaining orbital MRIs, it is recommended to include a coronal fat-suppressed T2-weighted or short tau inversion recovery (STIR) sequence and post-gadolinium coronal fat-suppressed T1-weighted sequences when gadolinium-based contrast agents are used.17 When available, 3D double inversion recovery (DIR) sequences can additionally be incorporated to increase sensitivity for asymptomatic lesions.21,22 Features of optic neuritis include increased T2-weighted signal intensity and gadolinium enhancement when acute optic neuritis is present.2324 Optic nerve lesions suggesting MS are typically unilateral, anterior, and short-segment. Alternatively, features suggesting non-MS etiologies include bilateral disease, long-segment lesions, posterior or optic chiasm involvement, and optic perineuritis.25 In our practice, we use MRI orbits, in addition to MRI brain, when evaluating acute optic neuritis cases, but we do not use MRI orbits in our routine MS evaluation. Please refer to the 2024 MAGNIMS-NAIMS-CMSC consensus recommendations for more information regarding MRI features and acquisition.17
OCT is a non-invasive imaging technique using near-infrared light to generate cross-sectional or three-dimensional images of the retina.26 Damage of the optic nerve leads to thinning of the retinal nerve fiber layer (RNFL) and composite macular ganglion cell and inner plexiform layer (GCIPL) due to degeneration. OCT can measure the thickness of both of these layers to detect symptomatic and subclinical optic nerve injury in MS.27-30 A peripapillary RNFL inter-eye difference of 6 micrometers or a GCIPL inter-eye difference of 4 micrometers supports the presence of demyelination in the optic nerve. Thinning can be detected as early as 3 months but is more prominent at 6 months post-optic neuritis.31 It is important that OCT acquisition follows strict criteria, known as the OSCAR-IB criteria, in order to use OCT to document optic nerve involvement. Guidelines regarding OCT acquisition are published in a companion paper to the diagnostic criteria.31
While MRI and OCT measure structural damage, VEPs assess functional damage by measuring the electrical conduction velocity in the visual pathways. The peak potential observed at 100 milliseconds (P100) is the most prominent waveform and reflects transmission of visual stimuli from the retina to the optic chiasm, reflecting conduction in the optic nerve. Delays in the P100 latency can assess anterior visual pathway dysfunction.32,33 A P100 latency delay 2.5 standard deviations above the laboratory reference mean can support the presence of a demyelinating optic nerve injury, but is not specific for optic nerve pathology. Delays can also be detected in other retinal disorders.32,33 Additionally, VEPs are sensitive for detecting damage in the acute phase of optic neuritis, but P100 latency delay often improves over time. 34 Each center performing VEPs should have experienced personnel and its own normative dataset to define P100 latency. Available guidelines include the International Society for Clinical Electrophysiology of Vision and the International Federation of Clinical Neurophysiology.31
Importantly, optic nerve damage detected by either OCT or VEP should be considered due to MS only if other causes have been reasonably excluded as several factors including concurrent ophthalmologic disorders and other comorbidities can affect the results.31,35 Additionally, bilateral eye disease not demonstrating sufficient inter-eye differences on OCT cannot be used to determine optic nerve involvement. Similarly, bilateral abnormalities on VEPs are difficult to interpret as these can be due to pre-or post-chiasmal lesions. Currently, there is also no consensus on the role of longitudinal changes in either modality to demonstrate DIT.31
At the Mellen Center, our practice is to use OCT during the diagnostic evaluation of possible MS. Although VEP is available at our institution, we routinely use OCT in clinic as it is a relatively inexpensive, non-invasive, point of care, and well-tolerated test. If OCT is not available at a center, VEPs can be used or centers can partner with local ophthalmology offices to obtain OCT.
Q: How is DIT determined in the 2024 McDonald criteria?
DIT is defined by simultaneous gadolinium-enhancing and non-enhancing lesions on a single MRI, the presence of new lesions on subsequent MRIs, or a new typical clinical attack.
Q: What is the central vein sign and how is it used to diagnose MS?
MS lesions have a characteristic peri-venular distribution on histological examination.36 Due to recent technological advances, the perivenous distribution of plaques can now be visualized in-vivo using susceptibility-sensitive magnetic resonance imaging (MRI) sequences.37 The central vein sign (CVS) is present in most MS lesions, and is absent in white matter lesions caused by common radiologic mimickers of MS including small vessel disease, other CNS inflammatory disorders, and migraine.38,39 The CVS is most commonly detected in periventricular and deep white matter lesions, but can also be seen in juxtacortical/cortical and infratentorial lesions.40 On susceptibility-sensitive MRI sequences, the CVS appears as a thin (<2 mm diameter) hypointense line or dot, present in two perpendicular planes and running partially or entirely through the center of a lesion (Figure 1). The CVS should not be assessed in lesions less than 3 mm in size, confluent lesions, lesions with multiple distinct veins, or poorly visible lesions.17,40 NAIMS has published specific criteria for determination of CVS.17
Several studies evaluated methods for determining when a scan should be considered CVS positive, and the Select 6 method was incorporated into the diagnostic criteria due to its optimal balance of sensitivity, specificity, and feasibility.1 The Select 6 method is considered positive when six or more white matter lesions are CVS positive, or when the majority of lesions are CVS positive if fewer than ten total lesions are present. In a systematic review and meta-analysis, the Select 6 method was shown to have a pooled sensitivity of 82% and a specificity of 89%.41
In the 2024 McDonald criteria, the CVS is not required to diagnose MS but can be used as a tool to diagnose MS and increase specificity in specific clinical scenarios. For any patient presenting with lesions in at least 2 anatomical locations (DIS), the presence of the Select 6 CVS can confirm the diagnosis of MS, regardless of symptoms (attack presentations, progressive presentation, symptoms not specific for MS, and incidental findings of demyelination). Additionally, in patients presenting with a typical attack or progression and lesions in only one anatomical location (excepting patients with progression and more than two spinal cord lesions), the presence of the Select 6 CVS plus DIT or positive CSF is sufficient for diagnosis.1
All MRIs completed per the demyelinating protocol at the Mellen Center report the presence or absence of the CVS. We most commonly use this information in clinical practice for the scenarios described and to increase specificity in patients with atypical features. More details regarding the specific MRI sequences used to detect the CVS are provided below.
Figure 1: Central vein sign.
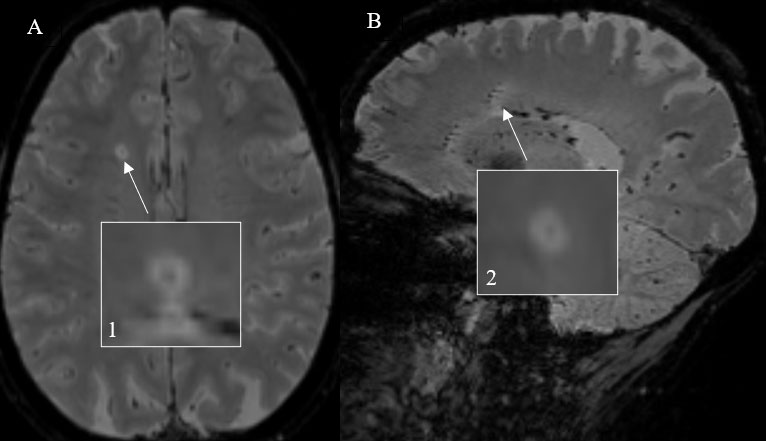
An example of a CVS-positive lesion (white arrows) using 3D T2*-weighted segmented echoplanar imaging is demonstrated on an axial (A, 1) and corresponding sagittal sequence (B, 2).
Q: What is a PRL and how is it used to diagnose MS?
Paramagnetic rim lesions (PRLs) are radiological biomarkers of chronic active MS lesions and are characterized on pathology by a demyelinated core surrounded by rim of activated iron-laden microglia.42,43 On susceptibility-sensitive sequences, PRLs appear as a lesion with a characteristic susceptibility rim surrounding a T2/FLAIR hyperintense white matter lesion (Figure 2). 43,44 A recent systematic review and meta-analysis found that PRL sensitivity is 56% and specificity is 99% for diagnosing MS.41 More information regarding image acquisition for PRL detection is provided below.
Similar to the CVS, PRLs can be used to diagnose MS in specific clinical scenarios but are not required to diagnose MS. However, PRLs are not as well-studied as the CVS, so their use in the diagnostic criteria is more limited. In people with a typical attack or progression and an MRI showing lesions in a single anatomical location, as well as DIT on MRI or positive CSF, MS is confirmed if one or more PRL are present.1 All MRIs completed per the demyelinating protocol at the Mellen Center report the presence of PRLs, and we use this information to diagnose MS as in the instances described.
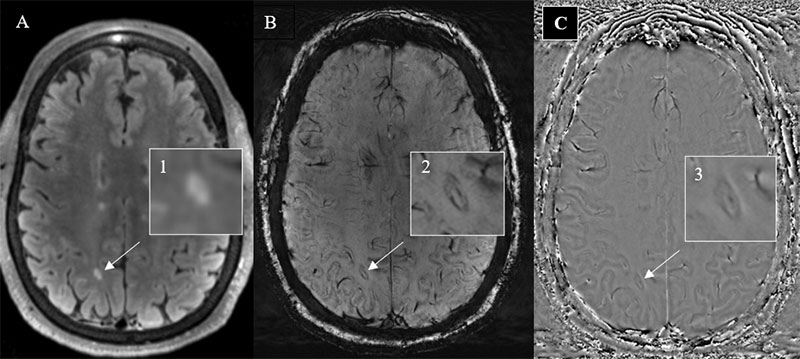
An example of a paramagnetic rim lesion (white arrows) is demonstrated on axial FLAIR (A, 1), SWI (B, 2), and filtered phase images (C, 3).
Q: Which MRI protocols are needed to detect CVS and PRL?
Susceptibility-sensitive imaging is used to detect the CVS and PRLs on MRI and is now recommended for routine use in MS imaging protocols.17 On standard susceptibility weighted imaging (SWI), lesions appear isointense, making standard SWI suboptimal for CVS detection. To better visualize lesions, T2-FLAIR images can be combined with or superimposed on susceptibility sensitive sequences to create a FLAIR* image capable of identifying veins and plaques.45 However, FLAIR* is not yet clinically available, but is in development. Instead, we use dedicated 3D T2* segmented echoplanar imaging (T2*-segEPI) acquisition, which is now available commercially for Siemens and Phillips Scanners and allows identification of both central veins and lesions. An alternative is to use an optimized SWI using a modified low flip angle to allow visualization of both lesions and veins (see supplement in 2024 MAGNIMS/CMSC/NAIMS MRI recommendations). PRLs are best observed on filtered phase images, which can be derived from either SWI images or T2*-segEPI.17 Clinically, processing is currently available on only GRE/SWI, so we obtain T2*-segEPI for CVS and SWI with filtered phase images for PRL. It is important to note that on phase images the appearance of iron varies depending on the scanner manufacturer. Siemens and Canon use a “left-handed” reference scheme, causing iron to appear bright. Philips and General Electric scanners use a “right-handed” reference, so iron appears dark.46 Both CVS and PRL can be detected on any strength magnet, but 3 and 7 tesla are more sensitive.44,47 If a 1.5 tesla scanner is used, gadolinium-based contrast agents should be administered before or during acquisition of susceptibility-sensitive sequences to improve detection of the CVS.44,48,49
Although the CVS and PRLs are not required for diagnosing MS, to aid in initial diagnosis and avoid future repeat scanning, susceptibility-sensitive imaging for detection of CVS and PRLs should be performed with all routine MS imaging protocols when feasible. Please refer to the 2024 MAGNIMS-CMSC-NAIMS consensus recommendations for the use of MRI in the diagnosis of MS for more detailed information regarding recommended imaging protocols.17
Q: How is CSF used to make the diagnosis of MS?
Intrathecal antibody production is a hallmark of MS, is present in the majority of people with MS, and predicts clinical attacks.50-52 CSF positivity is established by the presence of CSF-specific oligoclonal bands (OCBs) (immunoglobulin bands in CSF not matched in serum). Unique OCBs are identified in nearly 90% of patients with MS but are less prevalent in common mimickers such as NMOSD and MOGAD.52-54 OCBs are best detected by isoelectric focusing followed by immunoglobulin immunodetection. This process is time-consuming and rater-dependent, which limits the accurate assessment of OCBs to laboratories with expertise.55
Intrathecal kFLCs have emerged as a more standardized and widely applicable method of detecting intrathecal antibody production.1 Although there are multiple methods of quantifying kFLC, the kFLC index is the most studied. A systematic review and meta-analysis showed kFLC index has an average sensitivity of 88% and specificity of 89%, similar to OCBs.56 Additionally, there is a 90% concordance rate between kFLC index and OCBs.57 Compared to OCBs, the detection of kFLC is quantifiable, rater-independent, widely accessible, and less expensive. Institutions with access to nephelometry or turbidimetry can perform kFLC assessment. A kFLC index of ≥ 6.1 is considered positive for CNS inflammation across all platforms, but individual laboratories should verify this finding as the cutoff value can be specified based on performance characteristics of individual assays.56,58
In the 2024 McDonald criteria, either positive OCBs or kFLC index is indicative of intrathecal antibody synthesis and can be used to confirm the diagnosis of MS in patients with DIS.1 At the Mellen Center, we continue to routinely use OCBs. If able, both OCBs and kFLC should be sent when obtaining CSF samples as a positive result in either is capable of confirming the diagnosis. Of note, the IgG index has a lower sensitivity and accuracy compared to OCBs and kFLC index and is not recommended in the 2024 McDonald criteria to be used alone to confirm the diagnosis of MS.59
Q: Is MS diagnosed differently in progressive presentations compared to relapsing-remitting presentations?
In contrast to prior diagnostic criteria, the 2024 McDonald criteria uses a unified framework to diagnose relapse-onset and progressive-onset MS.1 Given the spinal cord is more frequently affected in primary progressive MS and there is a paucity of brain lesions, two or more spinal cord lesions fulfills DIS criteria in those with progression presentations.60 However, isolated spinal cord lesions and CSF findings should be interpreted cautiously. The remaining criteria and paraclinical evaluations are the same regardless of onset.
Q: How are the components of the McDonald criteria used to confirm a diagnosis of MS?
The definitions of DIS, DIT, anatomical locations, CSF testing, CVS, and PRL information are incorporated to make a diagnosis of MS based on clinical presentation (typical attack or progression vs. symptoms not specific for MS or asymptomatic with incidental findings of demyelination) and the number of anatomical locations involved. The criteria provide the minimum required clinical and paraclinical features to diagnose MS. In our practice, we prefer to make a robust case for the diagnosis to help reduce misdiagnosis rather than seeking the minimum data that fulfill the criteria.
For those with typical clinical attacks and progression the following criteria are used to confirm a diagnosis of MS.
| Anatomical regions affected | Features needed to diagnose MS |
| 4-5 | None |
| 2-3 | Any 1 of the following:
|
| 1 | Combination of the following:
≥2 spinal cord lesions and any 1 of the following
|
| 0 | Not able to make a diagnosis |
For patients presenting with symptoms not specific for MS and for asymptomatic patients with incidental findings of demyelination the following criteria are used to confirm a diagnosis of MS.
| Anatomical regions affected | Features needed to diagnose MS |
| 2-5 | Any 1 of the following:
|
| 0-1 | Not able to make a diagnosis |
Q: How is MS diagnosed in children?
In the 2024 McDonald criteria, the same diagnostic framework is used to make the diagnosis of both adult-onset and pediatric-onset MS (POMS). The criteria, however, indicate that in the initial presentation of acute disseminated encephalomyelitis the criteria should not be applied.1 The diagnosis of POMS requires a similar evaluation to rule-out mimickers, with required MOG IgG testing in children younger than 12 years and testing in those above age 12 in the presence of features atypical for MS.61 The CVS is useful in POMS and can help differentiate MS from MOGAD.62 However, since the Select 6 criteria has not been thoroughly evaluated in POMS, the CVS should be considered positive in pediatric patients only if over 50% of lesions show this sign.1 Although limited studies have demonstrated PRLs as a highly specific marker in POMS, there are insufficient data to use this marker to aid in diagnosing POMS at this time.63,64 The kFLC index was evaluated in only a small cohort of 73 patients with POMS, other demyelinating and inflammatory syndromes, and non-inflammatory controls, demonstrating the index performed similarly to adults.65 The use of OCT and VEPs in POMS is actively being investigated, and these modalities are not yet validated to the same extent as adults.31 OCT is technically feasible in POMS, but reference ranges vary with age in younger children compared to adults.66,67 At the Mellen Center, we routinely use OCT during the diagnostic evaluation and monitoring of POMS, similar to how we use OCT in adult-onset MS. Please refer to the Mellen Center Approach titled, “Pediatric-Onset Multiple Sclerosis,” for more information regarding the diagnosis and management of POMS.
Q: Which precautions should be taken when diagnosing MS in older individuals?
A new diagnosis of MS typically occurs in younger patients but sometimes is considered in older individuals.2 The prevalence of comorbidities associated with brain lesions mimicking MS, such as small vessel ischemic disease, increases with age, consequently increasing the risk of misdiagnosis.68,69 The 2024 McDonald criteria strongly recommend additional testing in patients aged 50 years or older, patients with headaches (particularly migraines), or patients with vascular risk factors (hypertension, hyperlipidemia, diabetes). In these groups additional features including presence of spinal cord lesions, positive CSF, or positive CVS or PRL are recommended when diagnosing MS. Although a consensus regarding utility of PRLs in this population was not reached for the 2024 McDonald criteria, PRLs are highly specific for MS, and we utilize them in differentiating patients with MS from those with mimics.70
References:
- Montalban X, Lebrun-Frenay C, Oh J, et al. Diagnosis of multiple sclerosis: 2024 revisions of the McDonald criteria. Lancet Neurol. Oct 2025;24(10):850-865. doi:10.1016/S1474-4422(25)00270-4
- Jakimovski D, Bittner S, Zivadinov R, et al. Multiple sclerosis. Lancet. Jan 13 2024;403(10422):183-202. doi:10.1016/S0140-6736(23)01473-3
- Walton C, King R, Rechtman L, et al. Rising prevalence of multiple sclerosis worldwide: Insights from the Atlas of MS, third edition. Mult Scler. Dec 2020;26(14):1816-1821. doi:10.1177/1352458520970841
- Hittle M, Culpepper WJ, Langer-Gould A, et al. Population-Based Estimates for the Prevalence of Multiple Sclerosis in the United States by Race, Ethnicity, Age, Sex, and Geographic Region. JAMA Neurol. Jul 1 2023;80(7):693-701. doi:10.1001/jamaneurol.2023.1135
- Langer-Gould A, Brara SM, Beaber BE, Zhang JL. Incidence of multiple sclerosis in multiple racial and ethnic groups. Neurology. May 7 2013;80(19):1734-9. doi:10.1212/WNL.0b013e3182918cc2
- Thompson AJ, Banwell BL, Barkhof F, et al. Diagnosis of multiple sclerosis: 2017 revisions of the McDonald criteria. Lancet Neurol. Feb 2018;17(2):162-173. doi:10.1016/S1474-4422(17)30470-2
- McDonald WI, Compston A, Edan G, et al. Recommended diagnostic criteria for multiple sclerosis: guidelines from the International Panel on the diagnosis of multiple sclerosis. Ann Neurol. Jul 2001;50(1):121-7. doi:10.1002/ana.1032
- Polman CH, Reingold SC, Edan G, et al. Diagnostic criteria for multiple sclerosis: 2005 revisions to the "McDonald Criteria". Ann Neurol. Dec 2005;58(6):840-6. doi:10.1002/ana.20703
- Polman CH, Reingold SC, Banwell B, et al. Diagnostic criteria for multiple sclerosis: 2010 revisions to the McDonald criteria. Ann Neurol. Feb 2011;69(2):292-302. doi:10.1002/ana.22366
- Kuhlmann T, Moccia M, Coetzee T, et al. Multiple sclerosis progression: time for a new mechanism-driven framework. Lancet Neurol. Jan 2023;22(1):78-88. doi:10.1016/S1474-4422(22)00289-7
- Freiha J, Riachi N, Chalah MA, Zoghaib R, Ayache SS, Ahdab R. Paroxysmal Symptoms in Multiple Sclerosis-A Review of the Literature. J Clin Med. Sep 25 2020;9(10)doi:10.3390/jcm9103100
- Lebrun-Frenay C, Rollot F, Mondot L, et al. Risk Factors and Time to Clinical Symptoms of Multiple Sclerosis Among Patients With Radiologically Isolated Syndrome. JAMA Netw Open. Oct 1 2021;4(10):e2128271. doi:10.1001/jamanetworkopen.2021.28271
- Solomon AJ, Arrambide G, Brownlee WJ, et al. Differential diagnosis of suspected multiple sclerosis: an updated consensus approach. Lancet Neurol. Aug 2023;22(8):750-768. doi:10.1016/S1474-4422(23)00148-5
- Banwell B, Bennett JL, Marignier R, et al. Diagnosis of myelin oligodendrocyte glycoprotein antibody-associated disease: International MOGAD Panel proposed criteria. Lancet Neurol. Mar 2023;22(3):268-282. doi:10.1016/S1474-4422(22)00431-8
- Wingerchuk DM, Banwell B, Bennett JL, et al. International consensus diagnostic criteria for neuromyelitis optica spectrum disorders. Neurology. Jul 14 2015;85(2):177-89. doi:10.1212/WNL.0000000000001729
- Krieger S, Cook K, Hersh CM. Understanding multiple sclerosis as a disease spectrum: above and below the clinical threshold. Curr Opin Neurol. Jun 1 2024;37(3):189-201. doi:10.1097/WCO.0000000000001262
- Barkhof F, Reich DS, Oh J, et al. 2024 MAGNIMS-CMSC-NAIMS consensus recommendations on the use of MRI for the diagnosis of multiple sclerosis. Lancet Neurol. Oct 2025;24(10):866-879. doi:10.1016/S1474-4422(25)00304-7
- Bsteh G, Hegen H, Altmann P, et al. Diagnostic Performance of Adding the Optic Nerve Region Assessed by Optical Coherence Tomography to the Diagnostic Criteria for Multiple Sclerosis. Neurology. Aug 22 2023;101(8):e784-e793. doi:10.1212/WNL.0000000000207507
- Vidal-Jordana A, Rovira A, Calderon W, et al. Adding the Optic Nerve in Multiple Sclerosis Diagnostic Criteria: A Longitudinal, Prospective, Multicenter Study. Neurology. Jan 9 2024;102(1):e200805. doi:10.1212/WNL.0000000000207805
- Petzold A, Fraser CL, Abegg M, et al. Diagnosis and classification of optic `. Lancet Neurol. Dec 2022;21(12):1120-1134. doi:10.1016/S1474-4422(22)00200-9
- Hodel J, Outteryck O, Bocher AL, et al. Comparison of 3D double inversion recovery and 2D STIR FLAIR MR sequences for the imaging of optic neuritis: pilot study. Eur Radiol. Dec 2014;24(12):3069-75. doi:10.1007/s00330-014-3342-3
- London F, Zephir H, Hadhoum N, et al. Optic nerve double inversion recovery hypersignal in patients with clinically isolated syndrome is associated with asymptomatic gadolinium-enhanced lesion. Mult Scler. Dec 2019;25(14):1888-1895. doi:10.1177/1352458518815797
- Kupersmith MJ, Alban T, Zeiffer B, Lefton D. Contrast-enhanced MRI in acute optic neuritis: relationship to visual performance. Brain. Apr 2002;125(Pt 4):812-22. doi:10.1093/brain/awf087
- Biousse V, Danesh-Meyer HV, Saindane AM, Lamirel C, Newman NJ. Imaging of the optic nerve: technological advances and future prospects. Lancet Neurol. Dec 2022;21(12):1135-1150. doi:10.1016/S1474-4422(22)00173-9
- Moheb N, Chen JJ. The neuro-ophthalmological manifestations of NMOSD and MOGAD-a comprehensive review. Eye (Lond). Aug 2023;37(12):2391-2398. doi:10.1038/s41433-023-02477-0
- Hrynchak P, Simpson T. Optical coherence tomography: an introduction to the technique and its use. Optom Vis Sci. Jul 2000;77(7):347-56. doi:10.1097/00006324-200007000-00009
- Petzold A, Balcer LJ, Calabresi PA, et al. Retinal layer segmentation in multiple sclerosis: a systematic review and meta-analysis. Lancet Neurol. Oct 2017;16(10):797-812. doi:10.1016/S1474-4422(17)30278-8
- Nolan-Kenney RC, Liu M, Akhand O, et al. Optimal intereye difference thresholds by optical coherence tomography in multiple sclerosis: An international study. Ann Neurol. May 2019;85(5):618-629. doi:10.1002/ana.25462
- Bsteh G, Hegen H, Altmann P, et al. Validation of inter-eye difference thresholds in optical coherence tomography for identification of optic neuritis in multiple sclerosis. Mult Scler Relat Disord. Oct 2020;45:102403. doi:10.1016/j.msard.2020.102403
- Outteryck O, Lopes R, Drumez E, et al. Optical coherence tomography for detection of asymptomatic optic nerve lesions in clinically isolated syndrome. Neurology. Aug 11 2020;95(6):e733-e744. doi:10.1212/WNL.0000000000009832
- Saidha S, Green AJ, Leocani L, et al. The use of optical coherence tomography and visual evoked potentials in the 2024 McDonald diagnostic criteria for multiple sclerosis. Lancet Neurol. Oct 2025;24(10):880-892. doi:10.1016/S1474-4422(25)00275-3
- Kothari R, Bokariya P, Singh S, Singh R. A Comprehensive Review on Methodologies Employed for Visual Evoked Potentials. Scientifica (Cairo). 2016;2016:9852194. doi:10.1155/2016/9852194
- Odom JV, Bach M, Brigell M, et al. ISCEV standard for clinical visual evoked potentials: (2016 update). Doc Ophthalmol. Aug 2016;133(1):1-9. doi:10.1007/s10633-016-9553-y
- Jones SJ. Visual evoked potentials after optic neuritis. Effect of time interval, age and disease dissemination. J Neurol. Sep 1993;240(8):489-94. doi:10.1007/BF00874118
- Petzold A, Chua SYL, Khawaja AP, et al. Retinal asymmetry in multiple sclerosis. Brain. Feb 12 2021;144(1):224-235. doi:10.1093/brain/awaa361
- Rae-Grant AD, Wong C, Bernatowicz R, Fox RJ. Observations on the brain vasculature in multiple sclerosis: A historical perspective. Mult Scler Relat Disord. Mar 2014;3(2):156-62. doi:10.1016/j.msard.2013.08.005
- Tan IL, van Schijndel RA, Pouwels PJ, et al. MR venography of multiple sclerosis. AJNR Am J Neuroradiol. Jun-Jul 2000;21(6):1039-42.
- Suthiphosuwan S, Sati P, Guenette M, et al. The Central Vein Sign in Radiologically Isolated Syndrome. AJNR Am J Neuroradiol. May 2019;40(5):776-783. doi:10.3174/ajnr.A6045
- Sinnecker T, Clarke MA, Meier D, et al. Evaluation of the Central Vein Sign as a Diagnostic Imaging Biomarker in Multiple Sclerosis. JAMA Neurol. Dec 1 2019;76(12):1446-1456. doi:10.1001/jamaneurol.2019.2478
- Sati P, Oh J, Constable RT, et al. The central vein sign and its clinical evaluation for the diagnosis of multiple sclerosis: a consensus statement from the North American Imaging in Multiple Sclerosis Cooperative. Nat Rev Neurol. Dec 2016;12(12):714-722. doi:10.1038/nrneurol.2016.166
- Toljan K, Amin M, Ontaneda D. Central vein sign and paramagnetic rim lesion abbreviated counting methods for diagnosis of multiple sclerosis: a systematic review and meta-analysis. Clin Radiol. Sep 2025;88:106984. doi:10.1016/j.crad.2025.106984
- Frischer JM, Weigand SD, Guo Y, et al. Clinical and pathological insights into the dynamic nature of the white matter multiple sclerosis plaque. Ann Neurol. Nov 2015;78(5):710-21. doi:10.1002/ana.24497
- Absinta M, Sati P, Fechner A, Schindler MK, Nair G, Reich DS. Identification of Chronic Active Multiple Sclerosis Lesions on 3T MRI. AJNR Am J Neuroradiol. Jul 2018;39(7):1233-1238. doi:10.3174/ajnr.A5660
- Hemond CC, Reich DS, Dundamadappa SK. Paramagnetic Rim Lesions in Multiple Sclerosis: Comparison of Visualization at 1.5-T and 3-T MRI. AJR Am J Roentgenol. Jul 2022;219(1):120-131. doi:10.2214/AJR.21.26777
- George IC, Sati P, Absinta M, et al. Clinical 3-tesla FLAIR* MRI improves diagnostic accuracy in multiple sclerosis. Mult Scler. Oct 2016;22(12):1578-1586. doi:10.1177/1352458515624975
- Vaccarino F, Quattrocchi CC, Parillo M. Susceptibility-Weighted Imaging (SWI): Technical Aspects and Applications in Brain MRI for Neurodegenerative Disorders. Bioengineering (Basel). Apr 29 2025;12(5)doi:10.3390/bioengineering12050473
- Castellaro M, Tamanti A, Pisani AI, Pizzini FB, Crescenzo F, Calabrese M. The Use of the Central Vein Sign in the Diagnosis of Multiple Sclerosis: A Systematic Review and Meta-analysis. Diagnostics (Basel). Nov 29 2020;10(12)doi:10.3390/diagnostics10121025
- Daboul L, O'Donnell CM, Cao Q, et al. Effect of GBCA Use on Detection and Diagnostic Performance of the Central Vein Sign: Evaluation Using a 3-T FLAIR* Sequence in Patients With Suspected Multiple Sclerosis. AJR Am J Roentgenol. Jan 2023;220(1):115-125. doi:10.2214/AJR.22.27731
- do Amaral LLF, Fragoso DC, Nunes RH, Littig IA, da Rocha AJ. Gadolinium-Enhanced Susceptibility-Weighted Imaging in Multiple Sclerosis: Optimizing the Recognition of Active Plaques for Different MR Imaging Sequences. AJNR Am J Neuroradiol. Apr 2019;40(4):614-619. doi:10.3174/ajnr.A5997
- Kolcava J, Pelisek O, Vlckova E. Predictive factors of multiple sclerosis relapse after the first demyelinating event: A 5-year follow-up. Mult Scler Relat Disord. Mar 2023;71:104566. doi:10.1016/j.msard.2023.104566
- Dobson R, Ramagopalan S, Davis A, Giovannoni G. Cerebrospinal fluid oligoclonal bands in multiple sclerosis and clinically isolated syndromes: a meta-analysis of prevalence, prognosis and effect of latitude. J Neurol Neurosurg Psychiatry. Aug 2013;84(8):909-14. doi:10.1136/jnnp-2012-304695
- Chen H, Liu SM, Zhang XX, et al. Clinical Features of Patients with Multiple Sclerosis and Neuromyelitis Optica Spectrum Disorders. Chin Med J (Engl). Sep 5 2016;129(17):2079-84. doi:10.4103/0366-6999.189046
- Bergamaschi R, Tonietti S, Franciotta D, et al. Oligoclonal bands in Devic's neuromyelitis optica and multiple sclerosis: differences in repeated cerebrospinal fluid examinations. Mult Scler. Feb 2004;10(1):2-4. doi:10.1191/1352458504ms988oa
- Ramdani R, Pique J, Deschamps R, et al. Evaluation of the predictive value of CSF-restricted oligoclonal bands on residual disability and risk of relapse in adult patients with MOGAD: MOGADOC study. Mult Scler. Mar 2025;31(3):290-302. doi:10.1177/13524585241311435
- Freedman MS, Thompson EJ, Deisenhammer F, et al. Recommended standard of cerebrospinal fluid analysis in the diagnosis of multiple sclerosis: a consensus statement. Arch Neurol. Jun 2005;62(6):865-70. doi:10.1001/archneur.62.6.865
- Hegen H, Walde J, Berek K, et al. Cerebrospinal fluid kappa free light chains for the diagnosis of multiple sclerosis: A systematic review and meta-analysis. Mult Scler. Feb 2023;29(2):169-181. doi:10.1177/13524585221134213
- Arrambide G, Espejo C, Carbonell-Mirabent P, et al. The kappa free light chain index and oligoclonal bands have a similar role in the McDonald criteria. Brain. Nov 21 2022;145(11):3931-3942. doi:10.1093/brain/awac220
- Deisenhammer F, Hegen H, Arrambide G, et al. Positive cerebrospinal fluid in the 2024 McDonald criteria for multiple sclerosis. EBioMedicine. Oct 2025;120:105905. doi:10.1016/j.ebiom.2025.105905
- Crespi I, Vecchio D, Serino R, et al. K Index is a Reliable Marker of Intrathecal Synthesis, and an Alternative to IgG Index in Multiple Sclerosis Diagnostic Work-Up. J Clin Med. Apr 2 2019;8(4)doi:10.3390/jcm8040446
- Brownlee WJ, Vidal-Jordana A, Shatila M, et al. Towards a Unified Set of Diagnostic Criteria for Multiple Sclerosis. Ann Neurol. Mar 2025;97(3):571-582. doi:10.1002/ana.27145
- Fadda G, Armangue T, Hacohen Y, Chitnis T, Banwell B. Paediatric multiple sclerosis and antibody-associated demyelination: clinical, imaging, and biological considerations for diagnosis and care. Lancet Neurol. Feb 2021;20(2):136-149. doi:10.1016/S1474-4422(20)30432-4
- Harrison KL, Gaudioso C, Levasseur VA, et al. Central Vein Sign in Pediatric Multiple Sclerosis and Myelin Oligodendrocyte Glycoprotein Antibody-Associated Disease. Pediatr Neurol. Sep 2023;146:21-25. doi:10.1016/j.pediatrneurol.2023.05.013
- Margoni M, Preziosa P, Storelli L, et al. Paramagnetic rim and core sign lesions in paediatric multiple sclerosis patients. J Neurol Neurosurg Psychiatry. Oct 2023;94(10):873-876. doi:10.1136/jnnp-2022-331027
- Micheletti L, Maldonado FR, Watal P, et al. Utility of paramagnetic rim lesions on 1.5-T susceptibility phase imaging for the diagnosis of pediatric multiple sclerosis. Pediatr Radiol. Jan 2022;52(1):97-103. doi:10.1007/s00247-021-05188-4
- Sarthou A, Chretien P, Giorgi L, et al. The kappa free light chains index is an accurate diagnostic biomarker for paediatric multiple sclerosis. Mult Scler. Oct 2024;30(11-12):1436-1444. doi:10.1177/13524585241274034
- Lommatzsch C, Capucci A, Grisanti S, Heinz C, Rothaus K. Age-Related Differences in Optical Coherence Tomography and Optical Coherence Tomography Angiography Parameters Between Healthy Children and Adults: A Comparative Analysis in a Caucasian Population. J Pers Med. Dec 17 2025;15(12)doi:10.3390/jpm15120629
- Sosa A, O'Neill KA, Jauregui R, et al. Relation of Visual Function, Retinal Thickness by Optical Coherence Tomography, and MRI Brain Volume in Pediatric-Onset Multiple Sclerosis. Neurol Neuroimmunol Neuroinflamm. Nov 2025;12(6):e200480. doi:10.1212/NXI.0000000000200480
- Marrie RA. Comorbidity in multiple sclerosis: implications for patient care. Nat Rev Neurol. Jun 2017;13(6):375-382. doi:10.1038/nrneurol.2017.33
- Midaglia L, Sastre-Garriga J, Pappolla A, et al. The frequency and characteristics of MS misdiagnosis in patients referred to the multiple sclerosis centre of Catalonia. Mult Scler. May 2021;27(6):913-921. doi:10.1177/1352458520988148
- Meaton I, Altokhis A, Allen CM, et al. Paramagnetic rims are a promising diagnostic imaging biomarker in multiple sclerosis. Mult Scler. Dec 2022;28(14):2212-2220. doi:10.1177/13524585221118677
