Neurological Institute Outcomes
Sleep Disorders
Sleep and Atrial Fibrillation
Pulmonary Physiologic Influences and Hypoxia in Development of Atrial Fibrillation
2023
Sleep-disordered breathing is a risk factor for atrial fibrillation (AF) however, the role of chronic intermittent hypoxia is less consistent in the literature. Hypoxia can be confounded by pulmonary physiologic influences such as obstructive or restrictive lung disease, or a restrictive pathophysiology caused by visceral adiposity. The objective was to describe the relationship between sleep-disordered breathing defined by an apnea hypopnea index (AHI), hypoxia defined by cumulative time in hypoxic range as well as minimum and mean oxygen saturation, and carbon dioxide with AF in a large clinical cohort, the SRATLIT Registry (Sleep Signals, Testing, and Reports Linked to Patient Trait), and then adjust these findings for objective pulmonary physiologic data gleaned from spirometry.
Patients who underwent sleep studies at the Cleveland Clinic between January 2, 2000 and December 30, 2015 were examined, Time-to-event models were constructed with predictors: AHI, percentage time oxygen saturation <90% (T90), minimum and mean oxygen saturation, and maximum end-tidal carbon dioxide, and outcome: incident AF. Models were adjusted for age, sex, race, body mass index, cardiopulmonary disease and risk factors, antiarrhythmic medications, and positive airway pressure. The patients with spirometry data were additionally adjusted for forced expiratory volume in 1 second (FEV1), forced vital capacity (FVC), and FEV1/FVC.
The cohort (N=42,057) was 52±14 years of age, 52% men, 75% White individuals, 19% Black individuals, and 5% other race, had median body mass index of 33 kg/m² (IQR 28-39), and 4.6% (N=1947) developed AF over 5 years.
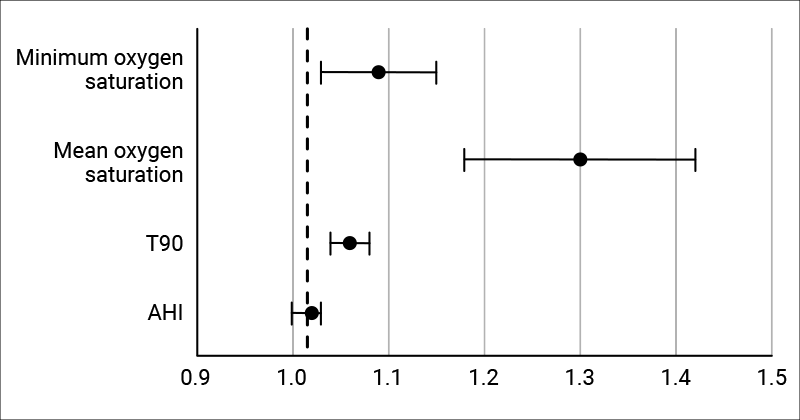
- A 10-unit increase in AHI was associated with 2% higher AF incidence (HR=1.02, 95% CI=1.00-1.03)
- A 10-unit increase in T90 was associated with 6% higher AF incidence (HR=1.06, 95% CI=1.04-1.08)
- A 10-unit decrease in mean oxygen saturation was associated with 30% higher AF incidence (HR=1.30, 95% CI=1.18-1.42)
- A 10-unit decrease in minimum oxygen saturation was associated with 9% higher AF incidence (HR=1.09), 95% CI=1.03-1.15)
- After adjustment for spirometry (N=9863), only hypoxia remained significantly associated with incident AF (T90 model adjusted for FEV1: HR 1.04, 95% CI=1.01-1.07; FVC: HR=1.04, 95% CI=1.01-1.07; and FEV1/FVC: HR=1.05, 95% CI=1.02-1.07) although all coefficients remained stable.
Sleep-related hypoxia was associated with incident AF in the clinical cohort, consistent across three measures of hypoxia and persistent after adjustment for pulmonary physiology. Results suggest an important role for sleep-related hypoxia in AF development without pulmonary physiologic interdependence.
Sleep Apnea-Specific Hypoxic Burden in Relation to Atrial Fibrillation
2023

While population-based and clinical studies have shown obstructive sleep apnea (OSA) increases the risk of atrial fibrillation (AF), an emerging area in elucidating the role of chronic intermittent hypoxia is the use of novel polysomnographic metrics. One such metric is the sleep apnea-specific hypoxic burden (SAHB). The hypothesis is that the SAHB was associated with AF development in the clinic-based SATRLIT Registry (Sleep Signals, Testing, and Reports Linked to Patient Traits).
Cleveland Clinic adult patients who underwent sleep studies between January 2, 2000 and December 30, 2017 were retrospectively examined. SAHB was computed as the area under the respiratory event-related desaturation curve, with depth as the difference between nadir and baseline and duration as a patient-specific search window. Baseline was determined as the maximum oxygen saturation in the 100 seconds prior to the end of the respiratory event. AF was ascertained by diagnosis code. Time-to-event models were fit for time from tobacco use, hypertension, diabetes, hyperlipidemia, heart failure, coronary artery disease, myocardial infarction, coronary artery bypass grafting, chronic obstructive pulmonary disease, anti-arrhythmic medications, and positive airway pressure therapy. Apnea hypopnea index (AHI) and percent time oxygen saturation <90% (T90) were also examined.
The sample included 23,671 patients who were median age 51[interquartile range (IQR) 41-61] years, 51% male, 74% White, 20% Black, and 6% other race, had median BMI of 34 [IQR 29-40] kg/m², and had median AHI of 18 (IQR 8-43). They were assessed over a follow-up period of 7±3 years. As a continuous measure in the adjusted model, a 10-unit SAHB increase was associated with a 1% increased incidence of AF (HR=1.01, 95% CI=1.01-1.02). Similarly, 10-unit increases in AHI and T90 were associated with 2% (HR=1.02, 95% IC=1.00-1.04) and 6% (HR=1.06, 95% CI=1.04-1.08) increased AF incidence, respectively.
In this clinical registry sub-sample (N~23k), SAHB was associated with increased incident AF over 7±3 year follow-up. Not only was hypoxia, T90, associated with AF, but SAHB, a measure of intermittent hypoxia specific to respiratory events, may represent a more accurate indicator of underlying sleep apnea-specific biology contributing to AF development.
Sleep Apnea-Specific Pulse Rate Response and Atrial Fibrillation
2023

Mechanistic animal studies implicate autonomic dysfunction in the pathogenesis of obstructive sleep apnea (OSA) and atrial fibrillation (AF). Polysomnographic correlates of autonomic fluctuations in OSA may be useful biomarkers of AF development. However, to date, reflective physiologic pulse rate response, i.e. delta heart rate (ΔHR) has yet to be examined in AF. The hypothesis is that this novel measure was associated with incident AF.
Cleveland Clinic adult patients without AF who underwent polysomnography between January 1, 2000 and December 31, 2017 were retrospectively examined. Time-to-even models evaluated time from sleep study to AF by diagnosis code. ΔHR was examined as a predictor adjusted for age, sex, race, body mass index (BMI), tobacco use, cardiopulmonary disease, anti-arrhythmic medications, positive airway pressure, beta-blockers, calcium channel blockers, digoxin, and minimum heart rate during respiratory events.
The sample included N=23,671 patients who were median age 51 [interquartile range (IQR) 41-61] years, 51% male, 74% white, 20% Black, and 6% other race, had median BMI of 34 [IQR 29-40] kg/m², and had median AHI of 18 (IQR 8-43). They were assessed over a follow-up period of 7 ± 3 years. As a continuous measure in the adjusted model, a 10-unit increase in ΔHR was associated with a 2% increased incidence of AF (HR=1.02, 95% CI=1.01-1.44). ΔHR was found to have a U-shaped association with AF, so low vs. mid-range and high vs. mid-range values were examined. High vs. mid-range ΔHR had a 29% increased AF incidence (HR=1.29, 95% CI=1.15-1.44) Low ΔHR did not confer an increased incidence of AF compared to mid-range values.
In this clinical cohort, signal-based OSA-specific autonomic response was associated with increased incident AF after accounting for confounders. Findings suggest that a heightened heart rate response is an important physiologic OSA-specific AF risk factor, and a dampened heart rate response is not. This may be a precision medicine phenotype to consider for treatment responsiveness and inclusion in clinical trials.
Sleep Architectural Disruption and Incident Atrial Fibrillation
2023

Sleep macro-architectural disruption has been implicated in atrial fibrillation (AF) in population-based studies. The objective was to clarify its unclear and inconsistent role.
Adult patients who underwent in-laboratory sleep studies at Cleveland Clinic between January 1, 2000 and December 30, 2015 were examined with an average follow-up of 7.6 ± 3.4 years. Sleep architecture predictors of AF included: arousal index, total sleep time (TST; hours), sleep efficiency (%), wakefulness after sleep onset (hours), sleep latency (minutes), rapid eye movement (REM) latency (minutes), and percentage of each sleep stage. These predictors were fit to time-to-event models which predicted time from sleep study to AF ascertained by diagnosis code from the electronic medical record. The models were adjusted for age, sex, race, median income by zip code, marital status, body mass index, neck circumference, tobacco use, Epworth Sleepiness Scale score, apnea-hypopnea index, hypertension, diabetes, hyperlipidemia, coronary artery disease, heart failure, myocardial infarction, coronary artery bypass grafting, stroke, depression, anxiety, anti-depressant use, sedative-hypnotics, antiarrhythmics, and positive airway pressure use.
The sample included N=40,465 patients who were 50.7 ± 14.2 years of age, 50.8% male, 73.8 % White, 20.1% Black, and 5.4% other race. 9% (N=3623) developed incident AF. For every hour of decreased total sleep time, AF increased by 5% (HR=1.05, 95% CI=1.03-1.08). For every 10 units of decreased sleep efficiency, AF increased by 5% (HR=1.05, 95% CI=1.03-1.07). For every hour of increased wakefulness after sleep onset, AF increased by 9% (HR=1.09, 95% CI=1.05-1.13). Arousal index, sleep latency, REM latency, and percentage of each sleep stage conferred no change in AF incidence.
Less sleep time and greater sleep disruption defined by sleep efficiency and wakefulness after sleep onset, but not sleep fragmentation i.e. arousal index, were associated with incident AF in this large clinical cohort. Findings implicate sleep disruption as a potential novel target for AF prevention.

