Obesity is commonly defined as having too much body fat. A BMI of 30 or higher is the usual benchmark for obesity in adults. Obesity increases the risk of serious medical conditions. Treatments include changing what you eat, adding activity and mental health support.
Advertisement
Cleveland Clinic is a non-profit academic medical center. Advertising on our site helps support our mission. We do not endorse non-Cleveland Clinic products or services. Policy
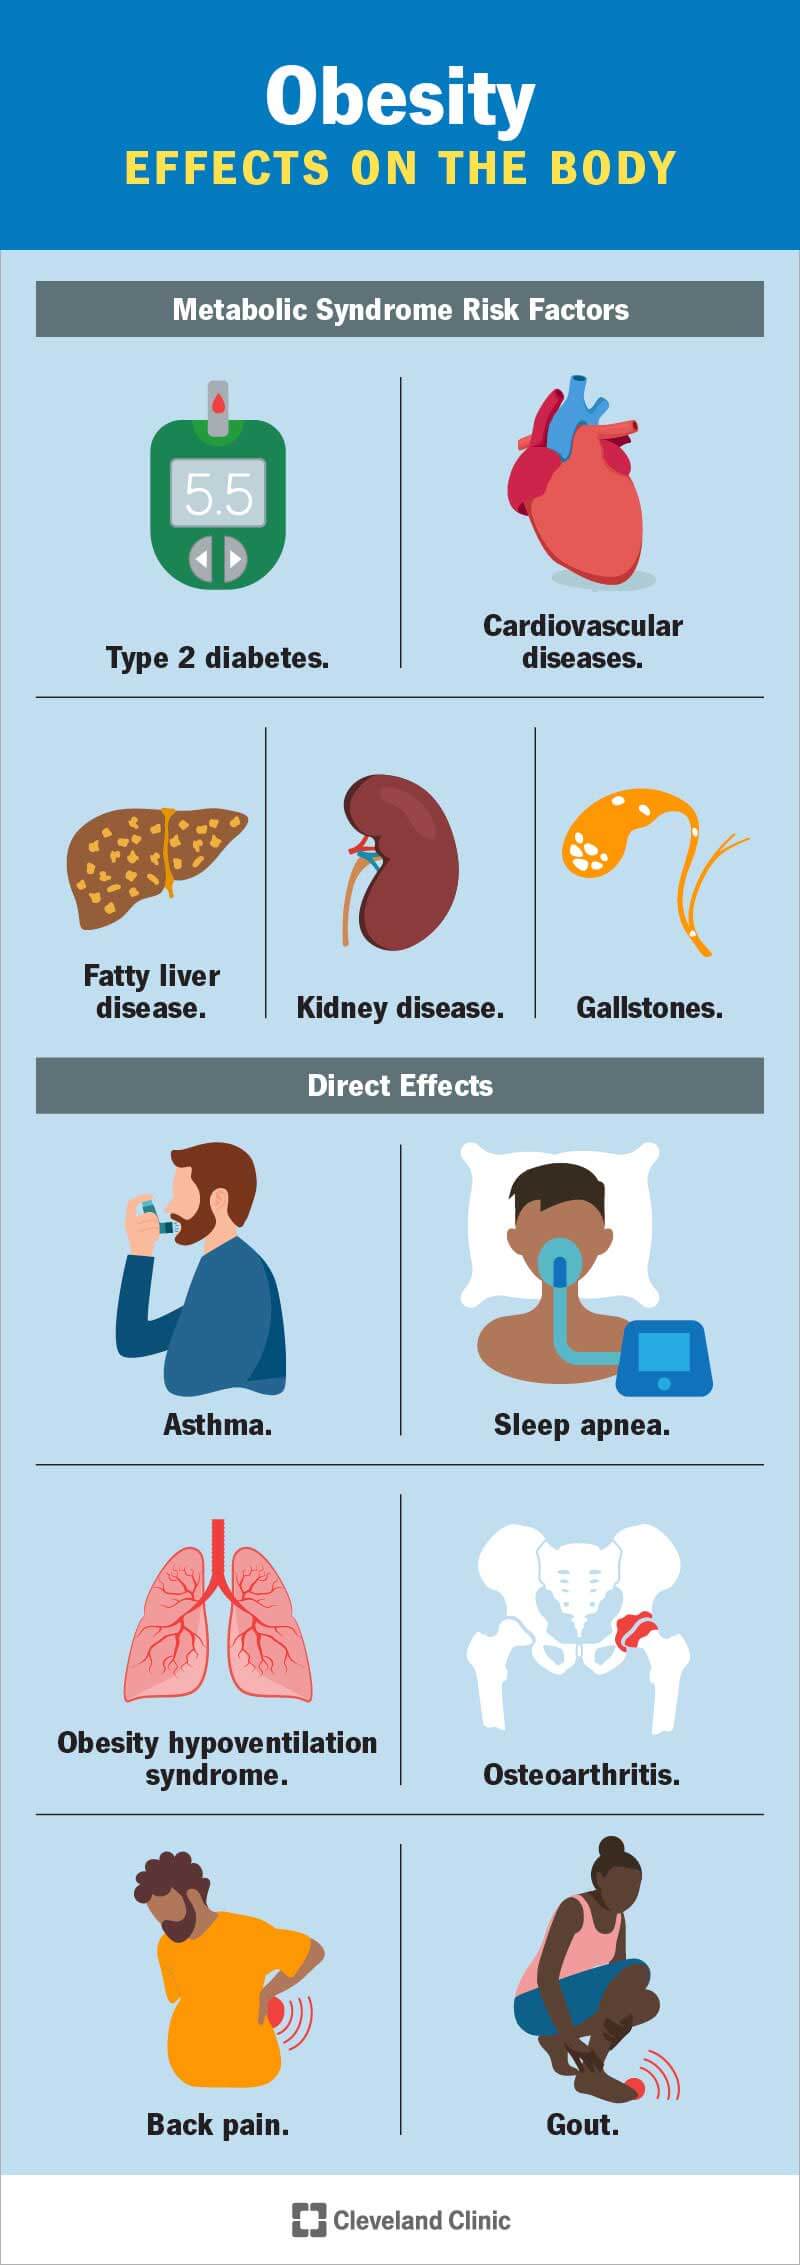
Image content: This image is available to view online.
View image online (https://my.clevelandclinic.org/-/scassets/images/org/health/articles/11209-obesity)
Obesity is when you have excessive body fat. It’s a chronic (long-term) and complex disease that can affect your overall health and quality of life. Obesity can lead to serious medical conditions. It can affect your self-esteem and mental health.
Advertisement
Cleveland Clinic is a non-profit academic medical center. Advertising on our site helps support our mission. We do not endorse non-Cleveland Clinic products or services. Policy
If you have obesity, you’re not alone. It’s a common disease that affects 2 in 5 adults in the United States. A healthcare provider can help you find the treatments and management strategies for your body and health.
While obesity is a disease, it doesn’t cause specific symptoms. A healthcare provider may define obesity by calculating your:
Healthcare providers classify obesity by your BMI. There are three general classes of obesity that providers use to decide what steps you can take to lose weight. Those classes are:
When you think about the BMI scale, it’s important to remember that the BMI scale doesn’t accurately predict specific health risks.
Where you carry extra weight may be a sign that you have more risk of health issues that obesity may cause. The U.S. Centers for Disease Control and Prevention (CDC) says a waist circumference of more than 35 inches in females or 40 inches in males can be a risk factor for cardiovascular disease or Type 2 diabetes.
Advertisement
On the most basic level, obesity happens when you consume more calories than your body can use. Many things may play a role in why you may eat more food than your body needs:
Obesity affects your body in many ways. For example, it may cause metabolic changes that increase your risk of serious illnesses. Obesity may also have direct and indirect effects on your overall health.
Your metabolism is how your body converts calories into energy to fuel your body. When your body has more calories than it can use, it converts the extra calories into lipids and stores them in your body fat. When you run out of tissue to store lipids, the fat cells themselves become enlarged. Enlarged fat cells secrete hormones and other chemicals that cause inflammation.
Inflammation can lead to insulin resistance so your body can’t use insulin to lower the sugar and fats in your blood. High levels of sugar and fats in your blood lead to high blood pressure. Combined, these conditions lead to metabolic syndrome. Metabolic syndrome is a common factor in obesity. The syndrome also increases your risk of developing diseases like:
Advertisement
Statistically, obesity increases your risk of premature death from all causes. Studies show you can reduce that risk by losing even a small amount (5% to 10%) of your current weight.
Excess body fat can crowd the organs of your respiratory system and put stress and strain on your musculoskeletal system. This contributes to:
Having obesity increases your risk of conditions and diseases like:
Your healthcare provider will measure your weight, height and waist circumference at your appointment. They may do body composition tests like a bone density test scan or a bioelectrical impedance analysis. This test measures body composition based on the rate at which an electrical current passes through your body. More importantly, they’ll want to know about your overall health. They’ll ask about:
Advertisement
Your provider will also examine your vital signs, and they may order certain blood tests. They’ll use this complete profile to diagnose obesity and any related conditions you might have.
Video content: This video is available to watch online.
View video online (https://cdnapisec.kaltura.com/p/2207941/sp/220794100/playManifest/entryId/1_12u39vkq/flavorId/1_5f3sgelj/format/url/protocol/https/a.mp4)
Obesity is a disease where an abnormal or excess accumulation of fat causes harm to one’s health.
Your healthcare provider will work with you to find a weight loss plan that works for you. Since everyone is different, it may take some trial and error to figure out which therapies work best:
Your healthcare provider may recommend that you add medication to your weight loss plan. Medications aren’t the whole answer to weight loss, but they can help tackle it from another angle. For example, appetite suppressants can intercept some of the pathways to your brain that affect your hunger. The following drugs have U.S. Food and Drug Administration (FDA) approval as obesity treatments:
Advertisement
If you have class III obesity, bariatric surgery may be an option for you. Bariatric surgery procedures work by changing your digestive system — usually your stomach, and sometimes also your small intestine — to regulate how many calories you can consume and absorb. They can also reduce the hunger signals that travel from your digestive system to your brain. Bariatric surgeries include:
Having obesity increases your risk of some serious medical conditions. But having obesity doesn’t mean you have those conditions or there’s nothing you can do to prevent them. Remember, weight loss of just 5% to 10% can significantly improve your health risks. Sticking with a long-term treatment plan can help you maintain weight loss.
Preventing obesity is easier than treating it once it’s taken hold. That’s because your body manages your body mass by shifting gears as it balances your hunger signals against the amount of energy you use from your daily activity. Once your body establishes a new high “set point," it considers that to be your new baseline weight. That new set point may put your weight higher on the scale or the BMI table. Examining your habits and making reasonable changes now can help you prevent future obesity. Here are some examples:
You may think your weight loss journey ends when you reach a certain weight. But obesity is a chronic disease. That means you’ll need to continue the steps you took to lose weight, like shopping intentionally and being active several days a week.
If you have obesity, you may feel like there’s nothing you can do to manage your condition. Those feelings are understandable and quite common. If you think you may have obesity, talk to a healthcare provider. They’ll help you find an approach to managing weight that’s right for you.


Sign up for our Health Essentials emails for expert guidance on nutrition, fitness, sleep, skin care and more.
Learn more about the Health Library and our editorial process.
Cleveland Clinic’s health articles are based on evidence-backed information and review by medical professionals to ensure accuracy, reliability and up-to-date clinical standards.
Cleveland Clinic’s health articles are based on evidence-backed information and review by medical professionals to ensure accuracy, reliability and up-to-date clinical standards.
Cleveland Clinic providers work together to develop weight management plans that address the challenges you face while finding your healthy weight.
